ACS-SASSI Helper
1. Introduction
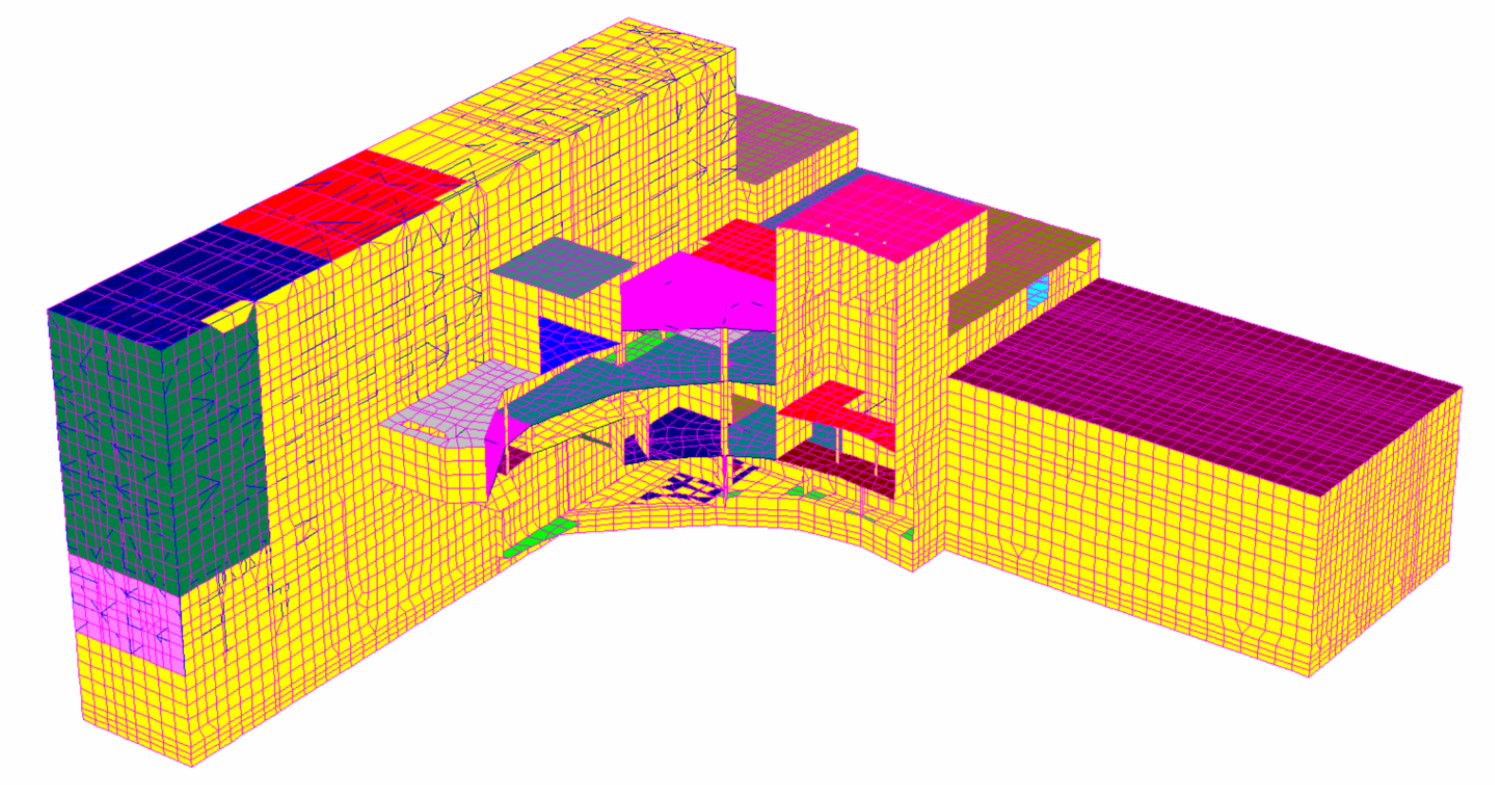
In modern seismic analyses for nuclear power plants, it is often essential to take into account the complex geometry of buildings by creating realistic, high definition 3D finite element models. Other posts on my website provide more details about these finite elements models.
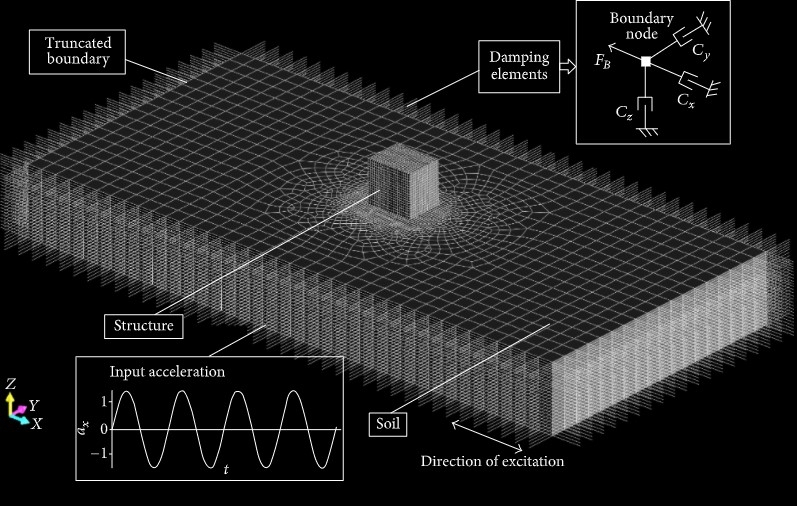
Building complex finite element models is not useful if the interface between the foundation of the building and the surrounding soil is neglected. The simplest modeling of this interface that has been used for over half a century is a fixed-base, meaning that the foundation of the building is rigidly attached to the outside world. More accurate modeling has been obtained in the last decades by modeling the soil with a 6-degree of freedom (3 translations, 3 rotations) spring and damper. However, in the 21st century, the NRC (The Nuclear Regulatory Commission, the authority regulating the nuclear industry) has been pushing for a more advanced type of analysis: a 3D Soil-Structure Interaction analysis, or simply 3D SSI.
Only one 3D SSI program has been endorsed by the NRC: ACS-SASSI. This program is capable of the most complex SSI calculations but its interface is difficult to navigate, and it can be cumbersome for users to simply observe the model from different angles or identify basic types of elements like beams, walls, slabs, and masses. Most importantly, in this program, it is laboriously inefficient to identify any kind of improper modeling when self or peer-reviewing work (in the nuclear industry, there are always two extra sets of eyes on the lead engineer’s work).
One recent mission I led was to repair an 3D ACS-SASSI model which had been poorly modeled a few years prior. Amongst other modeling errors: many walls and slabs were not connected to each other, the mass distribution had major flaws, beams were of the wrong element type, and slabs were assigned inaccurate thicknesses. In other words, it was utterly unusable for any engineering analysis, let alone for the post-Fukushima reevaluation this project was for.
To make matters worse, the input file for that model was a 127,000 line text file, and unlike other finite element programs like ANSYS, there are no modeling functions to generate geometry or auto-mesh. Every single node, every single element has to be manually entered one by one. Typically, programs like EXCEL are used to assist the engineer, but in this case, none of the intermediary files were available. Fixing this particuliar input file by hand would have taken many frustrating years.
With only two months budgeted for this project, I decided to write a Python code to help automate the repairs. At first, the goal was to fix the aforementioned deficiencies, but soon it became clear that many other benefits could emerge from this framework. For example, the code also provided a unique slab plotter, which automatically detected slabs and plotted them per elevations. Probably the most impactful benefit, however, is the fact that this new code is now a valuable companion in future 3D SSI analysis, and has already been adapted to other finite element programs.
All these features cannot be found in the ACS-SASSI user interface so this codes really speeds up the repairing, modeling and verification of complex models.
2. Features of the ACS-SASSI Helper
The 28,000 line program I wrote has the following features:
Building a model:
- adding nodal masses to slabs
- adding line beam elements and check alignment along shells
- building walls respecting connectivity
Debugging and validating the model:
- checking for warped elements
- checking for duplicate nodes
- checking for elements improperly connected
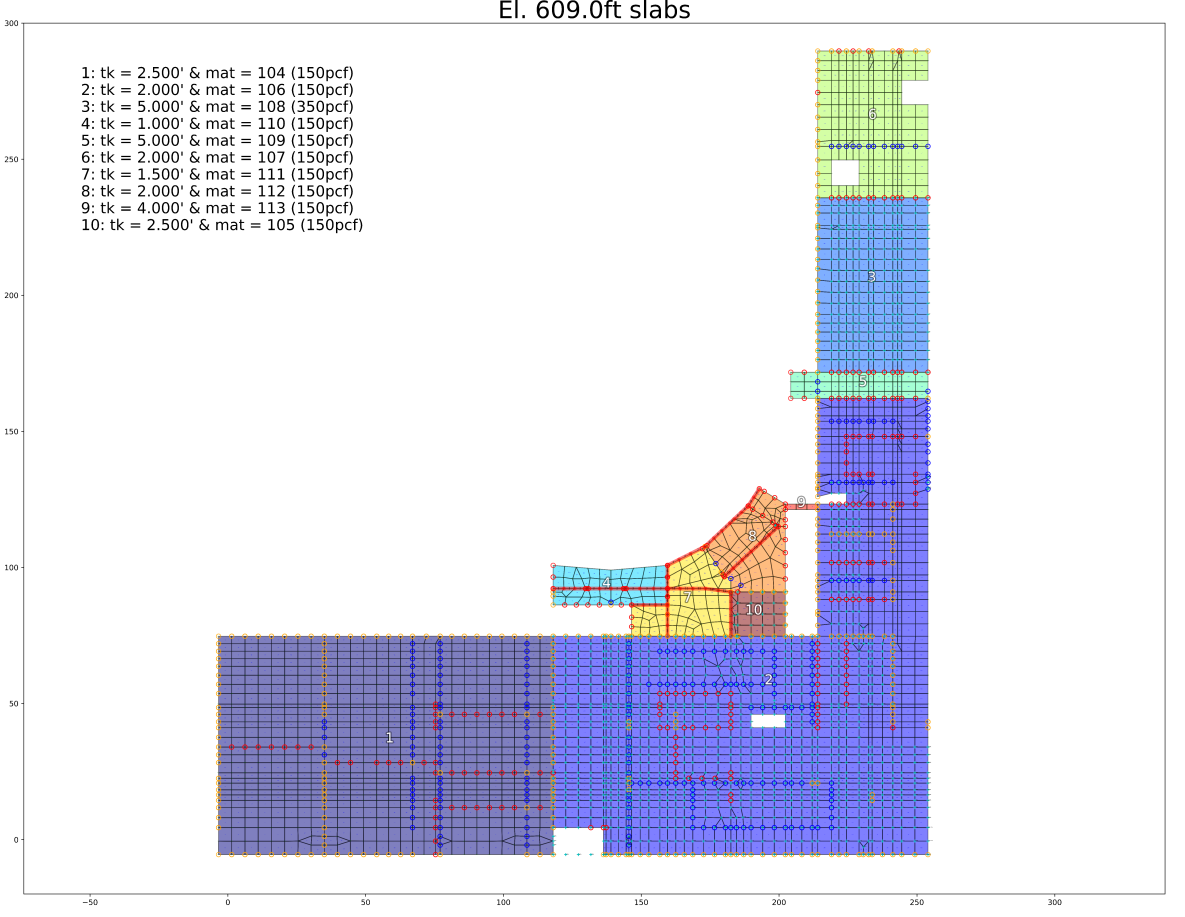
Slab plotter:
- automatically detects and displays edges of slabs of different properties
- shows nodes, shells and beams numbers all in one easy to read plot
- shows columns above/under slabs.
3. Output Examples
3.1. Detect Single Nodes
detect_single_nodes()
Node: 7474      Element: 8077 z: 591.0/595.5 x: 173.111/175.079 y: 104.547/107.679
                Nearest node is: 28895 at 0.000. All units in feet ****may be duplicate****

Node: 11973     Element: 11026 z: 604.5/609.0 x: 211.42/214.0 y: 162.156/162.156
                Nearest node is: 11972 at 2.300. All units in feet

Node: 16257     Element: 11596 z: 621.0/624.0 x: 241.25/241.25 y: 124.694/129.25
                Nearest node is: 14159 at 3.000. All units in feet

Node: 16243     Element: 11596 z: 621.0/624.0 x: 241.25/241.25 y: 124.694/129.25
                Nearest node is: 16237 at 1.444. All units in feet

Node: 16098     Element: 12717 z: 621.0/624.0 x: 159.5/159.5 y: 82.75/86.25
                Nearest node is: 16097 at 0.000. All units in feet ****may be duplicate****

Node: 16241     Element: 14390 z: 621.0/624.0 x: 249.5/254.0 y: 123.25/123.25
                Nearest node is: 14148 at 3.000. All units in feet
3.2. Plots with automatic slab detection